为什么要监控php-fpm的状态? 因为php-fpm多进程模型,线上一般都是static静态进程数配置,很容易因为I/O慢导致进程全部占满,造成拒绝服务。通过Prometheus采集PHP-FPM的性能指标来监控PHP-FPM
开启php-fpm status#
php-fpm配置#
1
2
3
4
5
|
#php-fpm.conf

[www]
pm.status_path = /phpstatus
listen = /dev/shm/php-cgi.sock
|
nginx配置#
1
2
3
4
5
6
|
#nginx.conf

location ~^/phpstatus$ {
    fastcgi_pass   unix:/dev/shm/php-cgi.sock;
    include fastcgi.conf;
}
|
php-fpm status详解#
 1
 2
 3
 4
 5
 6
 7
 8
 9
10
11
12
13
14
15
16
|
curl http://localhost/phpstatus

pool:                 www
process manager:      static
start time:           09/Mar/2022:08:19:49 +0000
start since:          18505708
accepted conn:        30247806
listen queue:         0    //请求等待队列,如果这个值不为0,那么要增加FPM的进程数量
max listen queue:     0    //请求等待队列最高的数量
listen queue len:     0    //socket等待队列长度
idle processes:       99    //空闲进程数量
active processes:     1     //活跃进程数量
total processes:      100   //总进程数量
max active processes: 19    //最大的活跃进程数量
max children reached: 0
slow requests:        3859  //慢日志数量
|
数据采集#
php-fpm-exporter采集数据#
1
2
3
4
5
|
#下载exporter
#https://github.com/bakins/php-fpm-exporter/releases

#启动exporter
./php-fpm-exporter.linux.amd64 --addr 0.0.0.0:9190 --endpoint=http://localhost/phpstatus
|
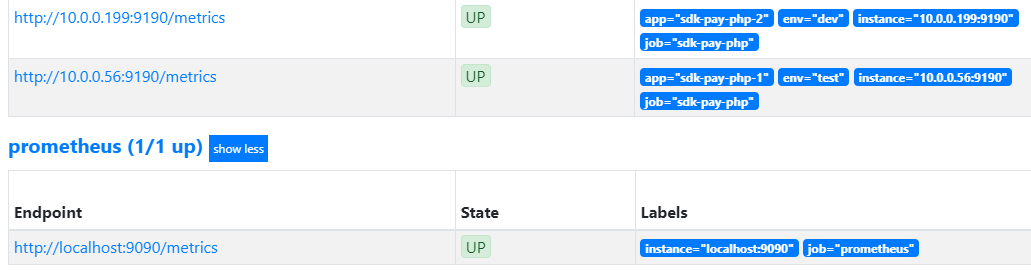
配置Prometheus#
 1
 2
 3
 4
 5
 6
 7
 8
 9
10
11
12
13
14
15
16
17
18
19
20
21
22
|
#targets.json

[
    {
          "targets":["10.0.0.100:9190"],
          "labels": {
              "job": "web-php",
              "app": "web-php-test",
              "env": "test",
              "instance": "10.0.0.100:9190"
          }
      },
      {
          "targets":["10.0.0.101:9190"],
          "labels": {
              "job": "web-php",
              "app": "web-php-dev",
              "env": "dev",
              "instance": "10.0.0.101:9190"
          }
      }
]
|
配置Grafana#
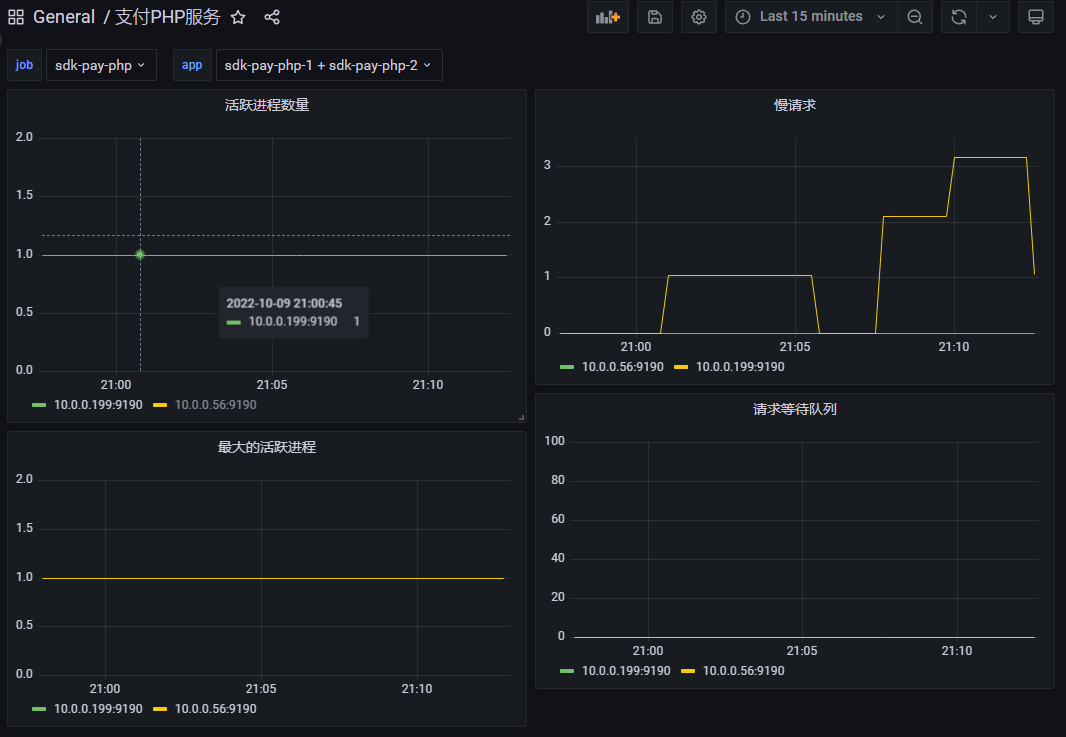
模板JSON